Svenska Cellulosa Aktiebolaget SCA (publ) – Annual report – 31 December 2025
Industry: agriculture
D3 Forest assets
ACCOUNTING PRINCIPLES
Forest assets in the accounts comprise biological assets and land but as the assets are normally traded together (meaning they are non-separable) the core market is deemed to consist of trading in forest properties. The total value of the forest assets is based on transactions conducted in the areas where SCA owns forest assets. To support this valuation, SCA retrieves statistics of transactions, which are available from a number of market sources. The value of the forest asset is calculated by multiplying the price level from the transactions by SCA’s standing volume. The level of the standing volume is based on historical forest inventory and simulated growth.
SCA’s valuation uses inputs, which under IFRS 13 Fair Value Measurement are recognized at various levels in the evaluation hierarchy, to measure its forest assets. The statistics obtained are market-validated inputs in accordance with measurement level 2. However, the valuation of forest assets is entirely allocated to level 3, as the estimated forest volume contains SCA’s own assessments and the suppliers of the transaction data make certain adjustments using unobservable inputs (see Key assessments and assumptions below). No transfers have taken place between the measurement levels during the year.
The total value of SCA’s forest assets is allocated between biological assets and land. Biological assets are valued in accordance with IAS 41 Agriculture using a DCF-model (discounted cash flow). The change in value is recognized in the income statement on the line for change in value in biological assets. The value of the land asset is calculated as the total value of the forest asset based on forest transactions less the value of the biological assets. To assess the reasonableness of the land value, SCA assesses the allocation between biological assets and the land, as well as a control valuation of the land asset using DCF-models. Land assets relating to forest assets are measured at fair value in accordance with IAS 16 Property, Plant and Equipment, paragraph 31, and are recognized on a separate line in the balance sheet under forest assets. The change in value pertaining to land assets is recognized as other comprehensive income and does not impact profit for the year.
KEY ASSESSMENTS AND ASSUMPTIONS
Key assumptions when assessing the value of total forest asset
Market price
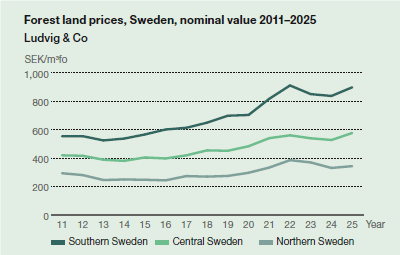
The market price that forms the basis for the valuation of forest assets relating to the Swedish forest holding is obtained from the providers Ludvig & Co and Svefa, which are two independent parties in relation to SCA. The providers process the data by adjusting market transactions that include other significant components in addition to forest land. Svefa also excludes forest land transactions below ten hectares. SCA makes no adjustments to data from Ludvig & Co and Svefa. SCA uses the data from the providers to calculate a volume-weighted price on the basis of where the forest assets are located geographically. The data from each supplier has the same weight in the valuation of the forest asset.
As the sale of forest properties usually takes longer and considering the delays in registration, there is a risk that the number of transactions in certain areas is too low to be representative when the measurement period is shorter. The price variation in individual forest properties can also be relatively large depending on the site productivity, age structure of the forest, distance to industry and urban areas, access to roads and any conservation values resulting in forestry restrictions. SCA’s assessment is that a sufficient number of transactions exist over a three-year period to obtain an adequate basis that reliably represents an average forest property in each geographical price area. SCA’s calculated market price is based on forest transactions over the last three years.
Data from suppliers is delivered to SCA distributed by regions in northern Sweden. SCA uses the distribution of suppliers as classes in its valuation and prices each class separately. The weight of the class in the total market price is according to the distribution of the standing volume in the latest forest inventory (2019).
Forest volume
The standing volume is based on SCA’s latest forest inventory conducted in 2019. In a forest inventory, an inventory of the standing volume is carried out based on statistically selected sample plots on SCA’s land, and these sample plots are used to simulate the standing volume of the entire stand. The forest inventory is also compared with the outcome of the Swedish National Forest Inventory on land owned by SCA. A comparison is also conducted between forest inventories. The Swedish National Forest Inventory is performed by the Swedish University of Agricultural Sciences (SLU), which is an independent party in relation to SCA. The standing volume includes only volumes from productive forest land.
A forest inventory is carried out roughly every ten years. Between forest inventories, the annual growth of the forest is simulated on the basis of the inventory. The simulation of SCA’s growth is carried out by an external party that is independent of SCA, and is then fixed until the next inventory. Growth is adjusted by the actual harvesting performed in SCA’s forest holding.
Baltic holding
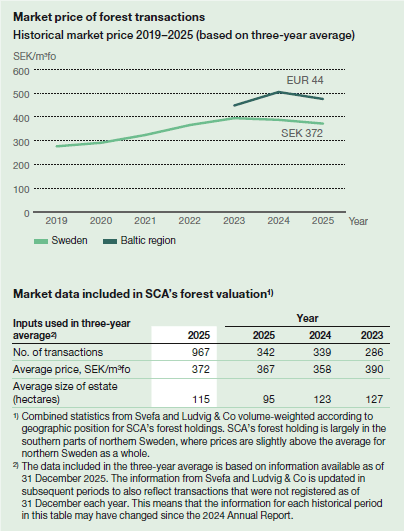
SCA uses a three-year average market price based on completed forest transactions in the Baltic region. Market statistics of forest land prices in the Baltic region are primarily obtained from Norskog, which is an independent party in relation to SCA. Since available data for forest property transactions in the Baltic region are less comprehensive than Swedish data, SCA uses other data sources to determine the price interval used to assess the price for valuation. SCA therefore obtains an external DCF valuation from Norskog, and SCA’s own transactions in the Baltic region are also used as an additional comparison together with other known transactions outside of Norskog’s statistics, such as transactions with legal entities. The range of the data sources indicated a price of EUR 43–62 (44–61) /m3fo on the balance sheet date. The growth of the standing volume in the Baltic region is calculated by Norskog.
Key assumptions when allocating the asset to biological assets and land
The total value of the forest asset is allocated between biological assets and land. Biological assets are valued using a DCF-model. The land asset is calculated as the total value of the forest asset based on forest transactions less the value of the biological assets.
The same allocation is used for the Baltic holding as for the Swedish holding, which is considered to be the best approximation of the allocation of the value of forest assets in the Baltic region.
Biological assets
The calculation to establish the value of biological assets is based on SCA’s existing, sustainable harvesting plans and assessments regarding growth, timber prices, harvesting and silviculture costs, and selling expenses. When cash flow was discounted, income and expenses were assessed using historical price trends that were adjusted upward by an annual inflation rate of 2% (2). SCA also capitalizes replanting costs.
Yield requirement
SCA estimates the yield requirement based on available data, which mainly consists of the National Land Survey’s guidance for forest valuation, comparable companies in the same industry and an estimate of the implicit yield requirement for the entire forest asset based on transactions made over a three-year period. See the section Market price for more information on the transactions used. SCA has made the assumption that the yield requirement for the forest asset as a whole and the biological asset do not differ significantly regardless of regions in northern Sweden and therefore uses the same yield requirement.
Based on the data collected, a range is determined within which the yield requirement for the biological asset is deemed to be, and based on an overall assessment and analysis of the available data, SCA determines a yield requirement within that range.
The yield requirement does not impact the total value of the forest asset but only the allocation of the value between biological assets and land assets.
Impact of climate change and political decisions
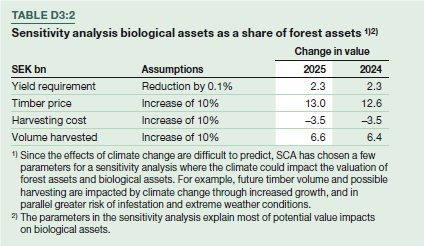
Climate-related risks and opportunities have been assessed using scenario analysis where both physical and transition risks were assessed, see the risk section of the Board of Directors’ Report. Climate change may mean a longer growing season, which may lead to an increase in harvesting volume. Increased risk of impact from extreme weather events such as storms, longer droughts or increased risk of infestation could reduce harvestable volume and increase harvesting costs. Increased demand for renewable products can boost demand for products based on forest raw materials, which could lead to higher timber prices. Political decisions and certification requirements that may restrict the extraction of raw material, the right to cultivate the forest and requirements for increased set-asides may reduce harvestable volume. Increased or decreased harvesting volume can in turn affect the supply of wood in the market and thus wood prices. The choice to participate in, or abstain from, voluntary certification systems can also affect wood prices. When valuing biological assets, these risks and opportunities are taken into account, for example the effects of climate change. Given the uncertainty about when the effects will occur in time and with what magnitude, the long production cycle of 100 years and the fact that they are expected to have both positive and negative effects, the Company’s best assessment in 2025 was that these had a neutral effect on the value of biological assets.
A sensitivity analysis is presented in table D3:2 that covers significant assumptions such as changed yield requirement, timber price, harvesting costs and volumes to provide an opportunity to estimate the value under other assumptions. Assumptions for the valuation of biological assets do not affect the total value of the forest asset, but only the distribution of the value between biological assets and land assets.
Valuation of total forest asset
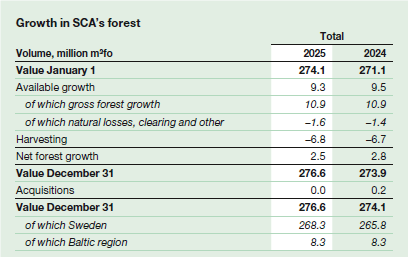
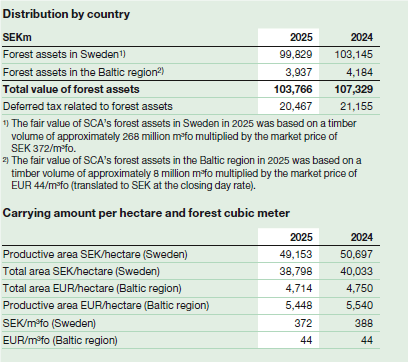
The market value of SCA’s forest asset is based on completed forest transactions, where the value is calculated by multiplying the average price level in the regions where SCA owns forests by SCA’s standing volume. SCA’s forest holdings in Sweden are made up of approximately 2.6 (2.6) million hectares of forest assets in northern Sweden, of which approximately 2.0 (2.0) million is productive forest land. SCA also owns just over 67,000 (66,000) hectares of forest land and 10,000 (11,000) hectares of other land in the Baltic region that can potentially be converted to forest land or be sold. Gross growth amounts to approximately 10.9 (10.9) million m3fo per year on productive forest area. Net growth, meaning growth after harvesting and natural losses, was estimated in 2025 at approximately 2.5 (2.7) million m3fo in Sweden and 0 (0.1) million m3fo in the Baltic region. As of December 31, 2025, timber volume was estimated to amount to approximately 268 (266) million m3fo in Sweden and approximately 8 (8) million m3fo in the Baltic region.
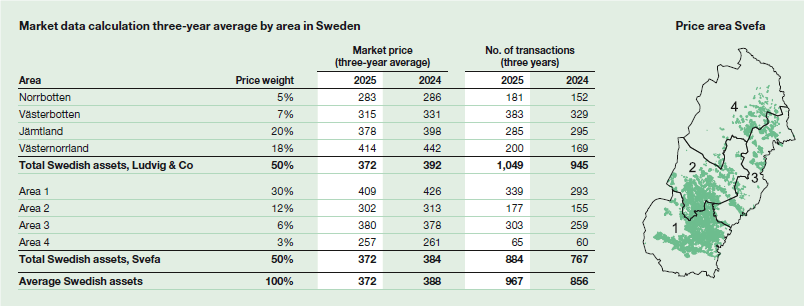
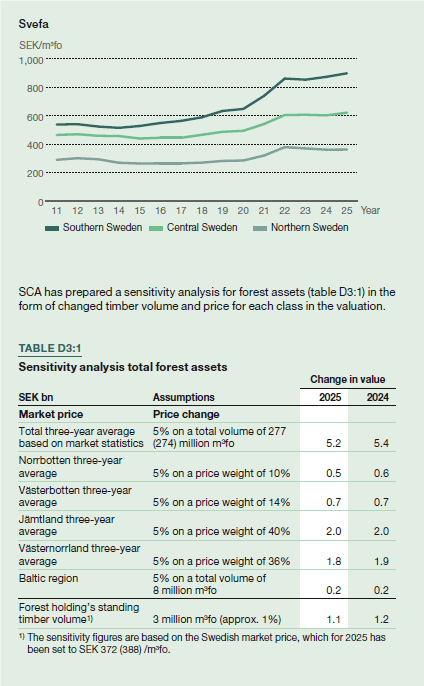
The total value of SCA’s forest assets is based on transactions in the areas where SCA owns forest properties. Each supplier’s price statistics for northern Sweden are divided into a number of regions. Ludvig & Co delivers statistics by county in northern Sweden and Svefa delivers its statistics by forest price area, as shown in the figure Price area Svefa, refer to the following page. All of SCA’s Swedish holdings are located in northern Sweden with a concentration in southern Norrland, as shown in the table Market data calculation three-year average by area in Sweden, refer to the following page. The price differences between the classes in the valuation are, in SCA’s opinion, mainly motivated by distance to industries (transportation costs), site productivity and distance to major cities/towns. In the suppliers’ data for 2025, SCA was a party in approximately 3% (2) of the transactions.
The three-year average price in 2025 was SEK 372/m3fo (388) and is used to determine the total average value per m3fo of SCA’s forest assets in Sweden. The corresponding price for the Baltic region is EUR 44/m3fo (44).
Allocation of total forest asset value
The current year’s valuation of biological assets and land assets was based on market statistics, forest volume and discounted cash flows. SCA uses a yield requirement that reflects the market’s required return for forest properties. For the current year’s valuation of biological assets, the same valuation model was used as in the previous year using a yield requirement of 3.9% (3.8) after tax. The yield requirement for investments in forest assets reflects the forest’s long cycles, and it is not affected by short-term variations in market rates.
Biological assets
The value of the biological assets was determined by establishing a DCF-model, where expected cash flows after tax are sales revenues less harvesting and sales costs. The level of harvesting from the forest is based on SCA’s latest long-term harvesting calculation, prepared 2020, and a production cycle that extends over approximately 100 years.
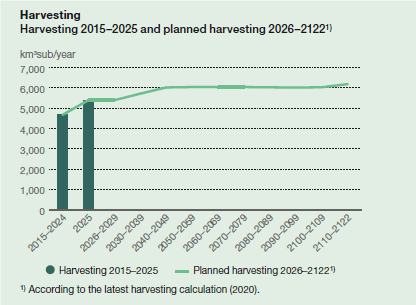
Assumptions regarding future price and cost levels are based on historical price trends adjusted for inflation. The valuation assumes an average timber price of SEK 575 (549) per m3sub. Annual harvesting in 2025 was 5.4 (5.2) million m3sub and is expected to rise over the future production cycle. Of this, 48% is expected on average over the years to comprise sawlogs and 52% pulpwood.
The change in the fair value of biological assets and change due to harvesting are recognized as a net value in the income statement on the line change in value in biological assets under IAS 41. The change amounted to SEK 1,782m (1,840) in the income statement, the change was driven primarily by higher long-term timber price. The total change in value of biological assets amounted to SEK 1,875m (2,141).
Yield requirement
SCA estimates that the yield requirement for areas where SCA has forest assets in Sweden was between 3.4–4.4% (3.3–4.4) after tax. SCA estimates that the yield requirement increased slightly in 2025 to 3.9% (3.8) after tax as long-term timber prices increased at the same time as the price level of forest properties decreased slightly.
If the lower end of the range for the yield requirement had been used, the biological assets would have been valued at SEK 75bn (73) and if the higher end of the range had been used the biological assets would have been valued at SEK 52bn (47), given that other assumptions remain unchanged. Sensitivity is also shown in table D3:2. A change in the yield requirement would not impact the carrying amount of the total forest asset.
The implicit yield requirement, which is based on transactions made and is an important input to the range, is based on 967 transactions (856) over the 2023–2025 period. No area had fewer than 65 transactions (60) during the measurement period. Total transaction volume corresponded to approximately 3% (4) of SCA’s total holdings.
Land assets
Forest land comprises the forest asset excluding the trees currently in the forest, and its cash flow consists mainly of future production cycles and other revenues from the land, such as wind power, gravel quarries and hunting. The value of forest land is calculated as the total value of the forest asset based on forest transactions less the value of the biological assets (trees currently standing on the land asset).
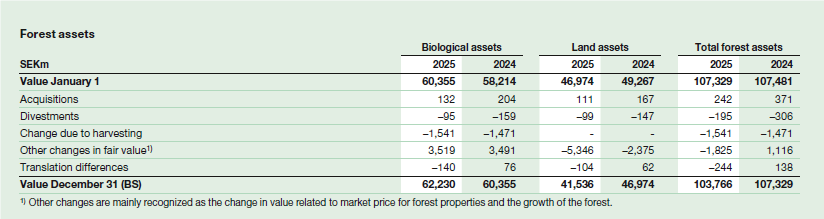
For 2025, the value of the land asset amounted to SEK 41,536m (46,974), meaning the total value of the forest asset of SEK 103,766m (107,329) less biological assets of SEK 62,230m (60,355).
The largest part of the cash flow from the land asset consists of harvesting from future generations of trees, meaning trees that will be planted. SCA’s assessment is that improved seedlings with higher growth, improved forest conditions and more efficient forest management will have a greater impact on future production cycles and thus land value.
Another important component of cash flow from the land asset is wind power leases. Lease income for 2025 amounted to SEK 99m (128) and is expected to increase as more land is leased for wind power.
The land asset can also generate revenue from wind power projects, meaning the sale of permits for wind power linked to the land holding. In addition, SCA sells gravel and stone material from the Company’s quarries as well as fishing and hunting rights.
The land asset also has the potential to generate new revenue streams in the future, such as green certificates. Accordingly, there is future potential cash flow from the land asset if the net capture of CO2 from the forest is included in existing or new emissions trading schemes. At present, no such system exists to generate cash flow for the land asset.
The change in fair value of the land asset is recognized in other comprehensive income and amounted to SEK –5,346m (–2,376) for 2025, the change was driven primarily by lower market price for forest land.
As the land asset is based on forest transactions less biological assets, the reader can use tables D3:1 and D3:2 to simulate the change in land value under different scenarios.
