Glencore plc – Annual report – 31 December 2025
Industry: mining
29. Fair value measurements (extract)
Fair values are primarily determined using quoted market prices or standard pricing models incorporating observable market inputs where available. The fair values are presented to reflect the expected gross future cash in/outflows. Glencore classifies the fair value measurements of its financial instruments into a three-level hierarchy based on the observability and source of the inputs used in the valuation:
Level 1 Inputs are quoted prices (unadjusted) in active markets for identical assets or liabilities accessible at the measurement date; or
Level 2 Inputs other than those included in Level 1 that are observable, either directly (as prices) or indirectly (derived from prices) for the asset or liability; or
Level 3 Unobservable inputs for the assets or liabilities, for which Glencore uses internally developed models and market-based assumptions.
Level 1 classifications primarily include futures with a tenor of less than one year and listed options. Level 2 classifications mainly comprise longer-dated futures (tenor greater than one year), OTC options, swaps, and physical forward transactions, where fair values are derived primarily from exchange quotations and readily observable broker quotes. Level 3 classifications primarily include
physical forward transactions whose fair values are derived predominantly from internal valuation models incorporating exchange traded and broker quotes as well as market-based estimates for factors such as location, quality, and credit differentials. They also include certain financial liabilities linked to the fair value of specific mining operations. In cases where observable market inputs are not available and Level 3 fair values are applied, it is possible that the use of a different valuation model or assumptions could result in a materially different estimate of fair value.
Derivative transactions are entered into under master netting agreements or long-form confirmations, which provide the legal right to offset amounts due to and from a common counterparty in the event of default, insolvency, or bankruptcy.
The following tables reflect the fair values of the derivative financial instruments including trade related financial and physical forward purchase and sale commitments by type of contract and non-current other financial assets and liabilities as at 31 December 2025 and 2024. Other assets and liabilities which are measured at fair value on a recurring basis include marketing inventories, other investments, cash and cash equivalents. There are no non-recurring fair value measurements requiring disclosure under IFRS Accounting Standards as issued by IASB.
13. Inventories
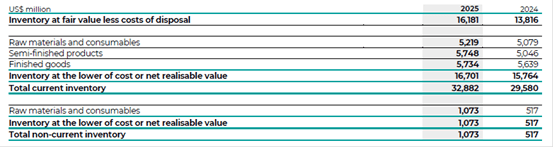
Current inventory
The amount of inventories and related ancillary costs recognised as an expense during the period was $222,164 million (2024: $208,030 million).
Fair value of inventories is predominantly determined using Level 2 inputs, based on observable market prices from exchanges, traded reference indices or market survey services, adjusted for relevant location and quality differentials. There are no significant unobservable inputs in the fair value measurement of such inventories.
Inventories of $299 million (2024: $144 million) are classified as Level 3 fair value measurements. These valuations are based on observable market prices obtained from exchanges, traded reference indices, or market survey services, adjusted for significant unobservable inputs including location and quality differentials. Movements during the year comprise unrealised losses of $44 million (2024: $5 million), recognised in cost of goods sold, purchases of $408 million (2024: $196 million) and sales of $209 million (2024: $263 million). A 10% change in pricing assumptions would result in a $5 million (2024: $6 million) adjustment to the current carrying value.
Glencore has a number of dedicated financing facilities that fund a portion of its inventories. In each case, the inventory has not been derecognised as the Group has not transferred control. Proceeds received under these arrangements are recognised as current borrowings (see note 21). As at 31 December 2025, the total value of inventory pledged under such facilities was $1,394 million (2024: $1,896 million) with corresponding proceeds recognised in current borrowings totalling $1,288 million (2024: $1,611 million).
Non-current inventory
Non-current inventories valued at the lower of cost or net realisable value are not expected to be utilised or sold within the normal operating cycle and are therefore classified as non-current inventory.
7. Impairments (extract)
2025 (extract)
Inventory and other
$261 million reversal of impairment on inventory and other. Certain ore stockpiles containing copper and cobalt at the KCC CGU (Industrial activities segment) were impaired in 2022 ($113 million) and 2024 ($148 million). Following the recent improvement in metal prices, these stockpiles have been reassessed as fully recoverable, and the previously recognised impairments have been reversed in full.
1. Accounting policies (extract)
Inventories
The majority of inventories attributable to the marketing activities are valued at fair value less costs of disposal with the remainder valued at the lower of cost or net realisable value, with costs allocated using the first-in-first-out (FIFO) method. Unrealised gains and losses from changes in fair value are reported in cost of goods sold.
Inventories held by the industrial activities are valued at the lower of cost or net realisable value. Cost is determined using FIFO or the weighted average method and comprises material costs, labour costs and allocated production-related overhead costs. Typically raw materials and consumables are measured using the FIFO method and work in progress inventories using the weighted average method. Where the production process results in more than one product being produced (joint products), cost is allocated between the various products according to the ratio of contribution of these metals to gross sales revenue. Financing and storage costs related to inventory are expensed as incurred.
Non-current inventories primarily relate to stockpiles which are not expected to be utilised within the normal operating cycle.
