Coca-Cola HBC AG – Annual report – 31 December 2025
Industry: food and drink
Alternative performance measures
Definitions and reconciliations of alternative performance measures (APMs)
1. Comparable APMs1
In discussing the performance of the Group, ‘comparable’ measures are used. Comparable measures are calculated by deducting from the directly reconcilable IFRS measures the impact of the Group’s restructuring costs, the mark-to-market valuation of the commodity hedging activity, the acquisition, integration and divestment-related costs, the impairment of goodwill and indefinite-lived intangible assets, the Russia-Ukraine conflict impact and certain other tax items, which are collectively considered as items impacting comparability, due to their nature. More specifically, the following items are considered as items that impact comparability:
1. Comparable APMs refer to comparable cost of goods sold, comparable gross profit, comparable operating expenses, comparable EBIT, comparable EBIT margin, comparable adjusted EBITDA, comparable profit before tax, comparable tax, comparable net profit and comparable EPS.
1. Restructuring costs
Restructuring costs comprise costs arising from significant changes in the way the Group conducts business, such as significant supply chain infrastructure changes, outsourcing of activities and centralisation of processes. These costs are included within the income statement line ‘Operating expenses’; however, they are excluded from the comparable results so that the users can obtain a better understanding of the Group’s operating and financial performance achieved from underlying activity. Restructuring costs resulting from initiatives driven by the Russia-Ukraine conflict, to the extent arisen in the period, are presented under the ‘Russia-Ukraine conflict impact’ item, to provide users with complete information on the financial implications of the conflict.
2. Commodity hedging
The Group has entered into certain commodity derivative transactions in order to hedge its exposure to commodity price risk. Although these transactions are economic hedging activities that aim to manage our exposure to sugar, aluminium, aluminium premium, gas oil, corn and plastics price volatility, hedge accounting has not been applied in all cases. In addition, the Group recognises certain derivatives embedded within commodity purchase contracts that have been accounted for as standalone derivatives and do not qualify for hedge accounting. The fair value gains or losses on the derivatives and embedded derivatives are immediately recognised in the income statement in the cost of goods sold and operating expenses line items. The Group’s comparable results exclude the gains or losses resulting from the mark-to-market valuation of these derivatives to which hedge accounting has not been applied (primarily plastics) and embedded derivatives. These gains or losses are reflected in the comparable results in the period when the underlying transactions occur, to match the profit or loss to that of the corresponding underlying transactions. We believe this adjustment provides useful information related to the impact of our economic risk management activities.
3. Acquisition, integration and divestment-related costs or gains
Acquisition costs comprise costs incurred to effect a business combination such as finder’s fees, advisory, legal, accounting, valuation and other professional or consulting fees as well as changes in the fair value of contingent consideration recognised in the income statement. They also include any gain from bargain purchase arising from business combinations, as well as any gain or loss recognised in the income statement from the remeasurement to fair value of previously held interests and the reclassification to the income statement of items of other comprehensive income resulting from step acquisitions. Integration costs comprise direct incremental costs necessary for the acquiree to operate within the Group. Divestment-related costs comprise transaction expenses, including advisory, consulting and other professional fees to effect the disposal of a subsidiary or equity method investment, any impairment losses or write downs to fair value less costs to sell recognised in the income statement upon classification as held for sale and any relevant disposal gains or losses or reversals of impairment recognised in the income statement upon disposal. These costs or gains are included within the income statement line ‘Operating expenses’; however, to the extent that they relate to business combinations or divestments that have been completed or are expected to be completed, they are excluded from the comparable results so that the users can obtain a better understanding of the Group’s operating and financial performance achieved from underlying activity.
4. Impairment of goodwill and indefinite-lived intangible assets
Impairment losses recognised for goodwill and indefinite-lived intangible assets as well as reversals of impairment losses recognised for indefinite-lived intangible assets, are included within the income statement line ‘Operating expenses’; however, they are excluded from comparable results so that the users can obtain a better understanding of the Group’s ongoing operating and financial performance.
5. Russia-Ukraine conflict impact
Incremental losses directly attributable to the Russia-Ukraine conflict are excluded from comparable results so that the users can obtain a better understanding of the Group’s operating and financial performance from underlying activity. Such losses include, to the extent arisen in the period, net impairment recognised on property, plant and equipment, intangible assets and equity method investments, as well as additional expected credit loss allowance and write-offs of inventory and property, plant and equipment.
6. Other tax items
Other tax items represent the tax impact of (a) changes in income tax rates arising during the year, affecting the opening balance of deferred tax and (b) certain tax-related matters selected based on their nature. Both (a) and (b) are excluded from comparable after-tax results so that the users can obtain a better understanding of the Group’s underlying financial performance.
The Group discloses comparable performance measures to enable users to focus on the underlying performance of the business on a basis which is common to both periods for which these measures are presented.
The reconciliation of comparable measures to the directly related measures calculated in accordance with IFRS is as follows:
Reconciliation of comparable financial indicators (numbers in € million except per share data)
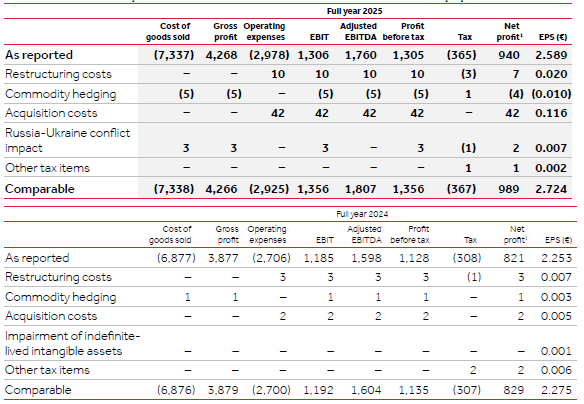
Figures are rounded.
1. Net profit and comparable net profit refer to net profit and comparable net profit respectively after tax attributable to owners of the parent.
Reconciliation of comparable EBIT per reportable segment (numbers in € million)
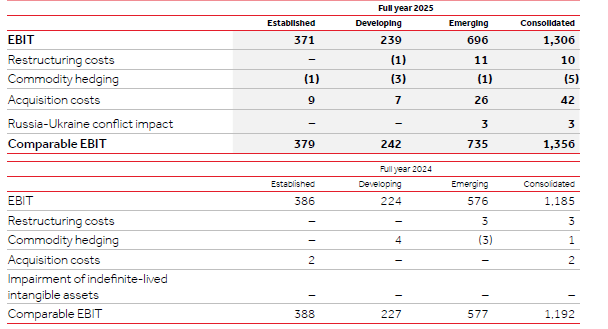
Figures are rounded.
2. Organic APMs
Organic growth
Organic growth enables users to focus on the operating performance of the business on a basis that is not affected by changes in foreign currency exchange rates from year to year or changes in the Group’s scope of consolidation (‘consolidation perimeter’), i.e. acquisitions, divestments and reorganisations resulting in equity method accounting. Thus, organic growth is designed to assist users in better understanding the Group’s underlying performance.
More specifically, the following items are adjusted from the Group‘s volume, net sales revenue and comparable EBIT in order to derive organic growth metrics:
(a) Foreign currency impact
Foreign currency impact in the organic growth calculation reflects the adjustment of prior-year net sales revenue and comparable EBIT metrics for the impact of changes in exchange rates applicable to the current year.
(b) Consolidation perimeter impact
Current-year volume, net sales revenue and comparable EBIT metrics are each adjusted for the impact of changes in the consolidation perimeter. More specifically, adjustments are performed as follows:
i. Acquisitions:
For current-year acquisitions, the results generated in the current year by the acquired entities are not included in the organic growth calculation. For prior-year acquisitions, the results generated in the current year over the period during which the acquired entities were not consolidated in the prior year are not included in the organic growth calculation.
For current-year step acquisitions where the Group obtains control of a) entities over which it previously held either joint control or significant influence and which were accounted for under the equity method, or b) entities which were carried at fair value either through profit or loss or other comprehensive income, the results generated in the current year by the relevant entities over the period during which these entities are consolidated are not included in the organic growth calculation. For such step acquisitions of entities previously accounted for under the equity method, the share of results for the respective period described above is included in the organic growth calculation of the current year. For such step acquisitions of entities previously accounted for at fair value through profit or loss, any fair value gains or losses for the respective period described above are included in the organic growth calculation. For such step acquisitions in the prior year, the results generated in the current year by the relevant entities over the period during which these entities were not consolidated in the prior year are not included in the organic growth calculation. However, the share of results of gains or losses from fair value changes of the respective entities, based on their accounting treatment prior to the step acquisition, for the current-year period during which these entities were not consolidated in the prior year are included in the organic growth calculation.
ii. Divestments:
For current-year divestments, the results generated in the prior year by the divested entities over the period during which the divested entities are no longer consolidated in the current year are included in the current year’s results for the purpose of the organic growth calculation. For prior-year divestments, the results generated in the prior year by the divested entities over the period during which the divested entities were consolidated are included in the current year’s results for the purpose of the organic growth calculation.
iii. Reorganisations resulting in equity method accounting:
For current-year reorganisations where the Group maintains either joint control or significant influence over the relevant entities so that they are reclassified from subsidiaries or joint operations to joint ventures or associates and accounted for under the equity method, the results generated in the current year by the relevant entities over the period during which these entities are no longer consolidated are included in the current year’s results for the purpose of the organic growth calculation. For such reorganisations in the prior year, the results generated in the current year by the relevant entities over the period during which these entities were consolidated in the prior year are included in the current year’s results for the purpose of the organic growth calculation. In addition, the share of results in the current year of the relevant entities, for the respective period as described above, is excluded from the organic growth calculation for such reorganisations.
The calculations of the organic growth and the reconciliation to the most directly related measures calculated in accordance with IFRS are presented in the tables on the next page. Organic growth (%) is calculated by dividing the amount in the row titled ‘Organic movement’ by the amount in the associated row titled ‘2024 reported’ or, where presented, ‘2024 adjusted’. Organic growth for comparable EBIT margin is the organic movement expressed in basis points.
Reconciliation of organic measures
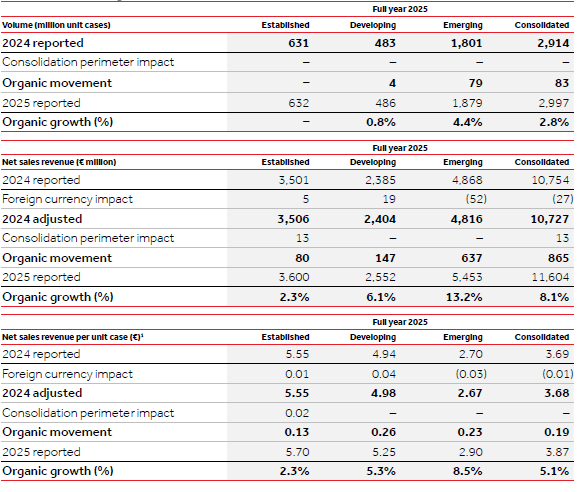
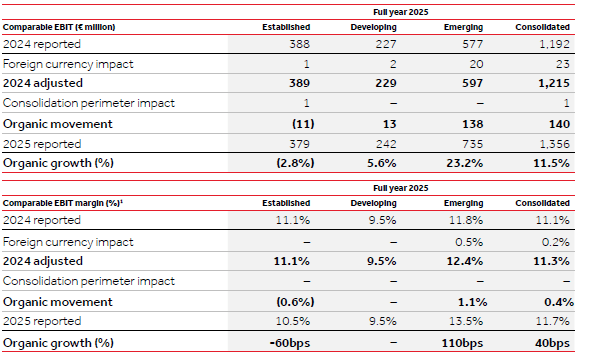
Figures are rounded.
1. Certain differences in calculations are due to rounding.
3. Other APMs
Adjusted EBITDA
Adjusted EBITDA is calculated by adding back to operating profit the depreciation and net impairment of property, plant and equipment, the amortisation and net impairment of intangible assets, the net impairment of equity method investments, the employee share option and performance share costs and items, if any, reported in line ‘Other non-cash items’ of the consolidated cash flow statement. Adjusted EBITDA is intended to provide useful information to analyse the Group’s operating performance excluding the impact of operating non-cash items as defined above. The Group also uses comparable adjusted EBITDA, which is calculated by deducting from adjusted EBITDA the impact of: the Group’s restructuring costs, the acquisition, integration and divestment-related costs or gains, the mark-to-market valuation of the commodity hedging activity and the impact from the Russia-Ukraine conflict. Comparable adjusted EBITDA is intended to measure the level of financial leverage of the Group by comparing comparable adjusted EBITDA with net debt.
Adjusted EBITDA and comparable adjusted EBITDA are not measures of profitability and liquidity under IFRS and have limitations, some of which are as follows: adjusted EBITDA and comparable adjusted EBITDA do not reflect our cash expenditures, or future requirements, for capital expenditures or contractual commitments; adjusted EBITDA and comparable adjusted EBITDA do not reflect changes in, or cash requirements for, our working capital needs; although depreciation and amortisation are non-cash charges, the assets being depreciated and amortised will often have to be replaced in the future, and adjusted EBITDA and comparable adjusted EBITDA do not reflect any cash requirements for such replacements. Because of these limitations, adjusted EBITDA and comparable adjusted EBITDA should not be considered as measures of discretionary cash available to us and should be used only as supplementary APMs.
Free cash flow
Effective 2025, the Group has amended its definition of free cash flow to exclude acquisition costs paid from net cash from operating activities. This amendment better reflects the purpose of this APM, which is to measure the cash generation arising from the Group’s business, as acquisition costs are incurred to effect a business combination, i.e. do not relate to the Group’s underlying operating activities but rather its investing activities. To ensure comparability, the prior-year free cash flow figure is restated to reflect the amended definition. More specifically, free cash flow is defined as cash generated by operating activities excluding acquisition costs paid, after payments for purchases of property, plant and equipment net of proceeds from sales of property, plant and equipment and including principal repayments of lease obligations. Free cash flow is intended to measure the cash generation from the Group’s business, based on operating activities, including the efficient use of working capital and taking into account its net payments for purchases of property, plant and equipment. The Group considers the purchase and disposal of property, plant and equipment as ultimately non-discretionary since ongoing investment in plant, machinery, technology and marketing equipment, including coolers, is required to support the day-to-day operations and the Group’s growth prospects. The Group presents free cash flow because it believes the measure assists users of the financial statements in understanding the Group’s cash generating performance as well as availability for interest payment, dividend distribution and own retention. The free cash flow measure is used by management for its own planning and reporting purposes since it provides information on operating cash flows, working capital changes and net capital expenditure that local managers are most directly able to influence.
Free cash flow is not a measure of cash generation under IFRS and has limitations, some of which are as follows: free cash flow does not represent the Group’s residual cash flow available for discretionary expenditures since the Group has debt payment obligations that are not deducted from the measure; free cash flow does not deduct cash flows used by the Group in other investing and financing activities, and free cash flow does not deduct certain items settled in cash. Other companies in the industry in which the Group operates may calculate free cash flow differently, limiting its usefulness as a comparative measure.
Capital expenditure
Capital expenditure is defined as payments for purchases of property, plant and equipment plus principal repayments of lease obligations less proceeds from sales of property, plant and equipment. The Group uses capital expenditure as an APM to ensure that cash spending is in line with its overall strategy for the use of cash.
The following table illustrates how adjusted EBITDA, Free cash flow and Capital expenditure are calculated:
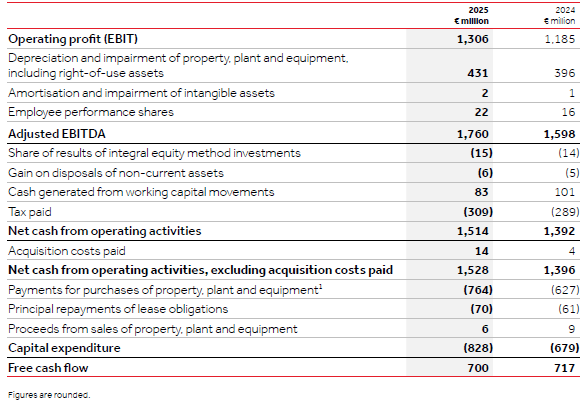
1. Payments for purchases of property, plant and equipment for 2025 include €12 million (2024: €12 million) relating to repayment of borrowings undertaken to finance the purchase of production equipment by the Group’s subsidiary in Nigeria, classified as ‘Repayments of borrowings’ in the consolidated cash flow statement.
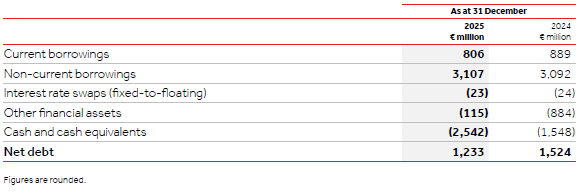
Net debt
Net debt is an APM used by management to evaluate the Group’s capital structure and leverage. Net debt is defined as current and non-current borrowings, net of the fair value of fixed-to-floating interest rate swaps, less cash and cash equivalents and financial assets (time deposits and money market funds), as illustrated below:
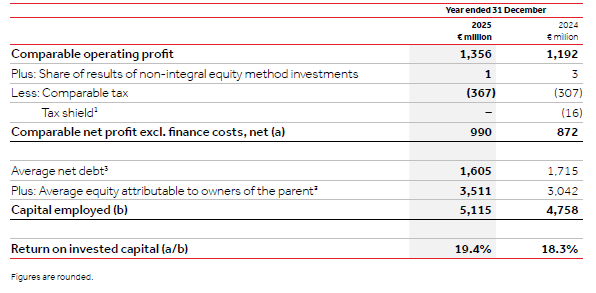
Return on invested capital (ROIC)
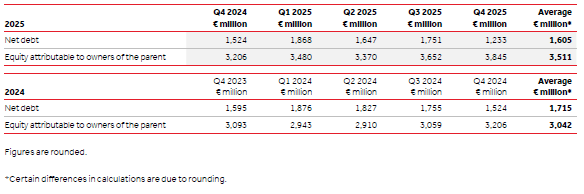
ROIC is an APM used by management to assess the return obtained from the Group’s asset base and is defined as the percentage of comparable net profit excluding net finance costs divided by the five-quarter average capital invested in the business (‘capital employed’). Capital employed is defined as the average net debt and shareholders’ equity attributable to the owners of the parent, as illustrated below. The Group presents ROIC because it believes the measure assists users of the financial statements in understanding the Group’s capital efficiency.
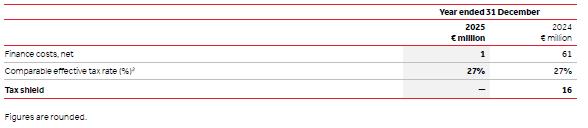
1. Tax shield is calculated as comparable effective tax rate times finance costs, net, as illustrated below:
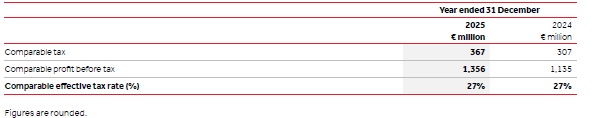
2. Comparable effective tax rate is calculated as comparable tax divided by comparable profit before tax, as illustrated below:
Five-quarter average net debt and equity attributable to owners of the parent are calculated as presented below: