SAP SE – Annual report – 31 December 2025
Industry: software
Performance Management System
In the reporting year, we used various measures to manage our performance on our primary financial objectives, which are growth and profitability, and on our primary non-financial objectives, which are customer loyalty, employee engagement, climate performance, and business health culture.
Measures to Manage Our Financial Performance
The following are the key measures we use to manage our operating and overall financial performance. Except for free cash flow, we report our key measures at both actual and constant currencies.
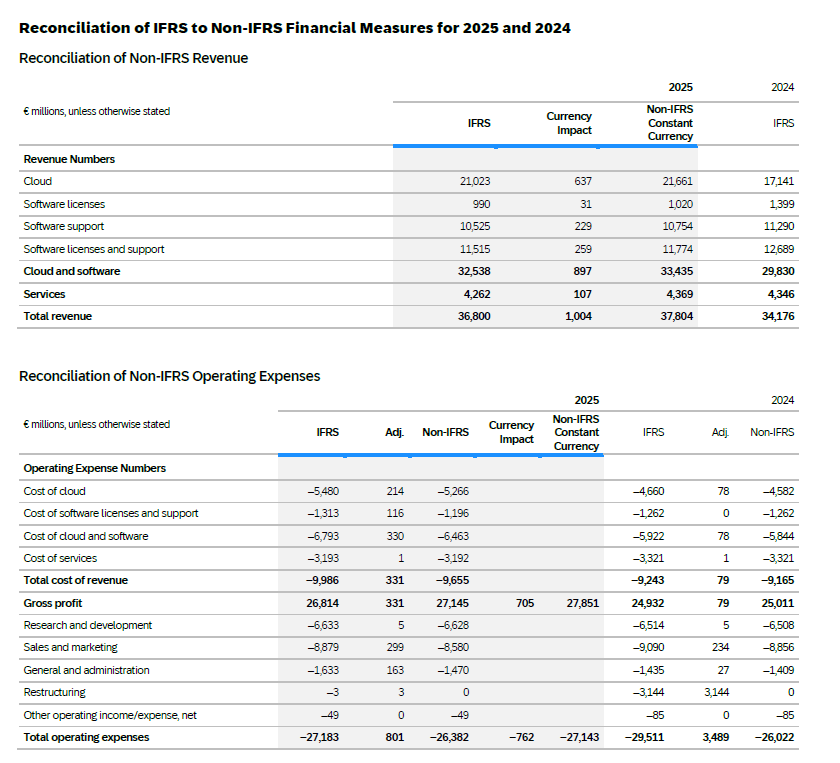
We use cloud revenue, cloud and software revenue, current cloud backlog (CCB), and total revenue to measure our progress toward our growth targets. Cloud revenue comprises the main revenues of our cloud business and is derived from fees earned from providing customers with software as a service (SaaS), platform as a service (PaaS), and infrastructure as a service (IaaS). Cloud and software revenue includes cloud revenue, software license revenue, and software support revenue. The vast majority of customers who purchase software licenses also enter into related support contracts with us that generate recurring support revenue after the software sale. Cloud revenue is our largest revenue stream, followed by software support revenue. For more information about our revenue measures, see the Notes to the Consolidated Financial Statements 2025, Note (A.1).
As of a specific key date, the CCB is the contractually committed cloud revenue we expect to recognize over the upcoming 12 months. It is therefore a subcomponent of our overall remaining performance obligations, as per IFRS 15.120. Contractual periods that are subject to a customer termination for convenience right without a significant early-termination fee, or that are subject to a termination right under applicable law, are excluded from our CCB. For our committed cloud business, we believe the CCB is a valuable indicator of our go-to-market success, as it reflects both new contracts and contract renewals.
To measure our profitability, we primarily use operating profit (non-IFRS) and free cash flow. Operating profit (non-IFRS) offers insight into our overall operational process efficiency and business performance, while free cash flow provides management with supplemental information for assessing our liquidity needs and position. Free cash flow is used to determine the cash flow remaining after all net expenditures required to maintain or expand our organic business have been paid off.
Besides the key measures mentioned above, SAP also uses various supporting measures to offer further insight into our financial performance. These include Cloud ERP Suite revenue,8 total cloud backlog (TCB),9 share of more predictable revenue,10 subscription revenue, cloud gross profit, and effective tax rate (non-IFRS).11 The subscription revenue measure, introduced in 2025, is the sum of cloud revenue and revenue from time-based on-premise software licenses, which allow our customers to use our software for a specific, predefined period, and the associated software support. Revenue from time-based on-premise licenses is recognized at a point in time, whereas revenue from the associated software support is recognized over time. We use the subscription revenue measure as an indicator of SAP’s revenues, most of which are recurring, across deployment models and offerings that for strategic reasons are sustained over time. It does not include software licenses and support revenue from our perpetual licenses. From 2026 onward, subscription revenue will replace the share of more predictable revenue. We report most of our supporting measures both at actual and constant currencies.
8 We use Cloud ERP Suite revenue as a metric to measure the growth of our portfolio of strategic cloud solutions. Cloud ERP Suite references those offerings that are tightly integrated with our core ERP solutions and are included in key commercial packages, such as RISE with SAP. The following offerings contribute to Cloud ERP Suite revenue: SAP S/4HANA Cloud, SAP Business Technology Platform, and core solutions for People & Culture and payroll, spend management, commerce, customer data solutions, business process transformation, and working capital management.
9 As of a specific key date, the TCB is the total contractually committed cloud revenue we expect to recognize. Thus, TCB and CCB are both subcomponents of our overall remaining performance obligations following IFRS 15.120. For our committed cloud business, we believe that the TCB and the CCB are valuable indicators of our go-to-market success, as they reflect both new contracts and contract renewals. Contractual periods that are subject to a customer termination for convenience right without a significant early-termination fee, or that are subject to a termination right under applicable law, are excluded from our CCB and TCB. For more information about how we calculate these numbers, see the Notes to the Consolidated Financial Statements, Note (A.1).
10 The share of more predictable revenue is the total of cloud revenue and software support revenue divided by total revenue.
11 We define our effective tax rate as the ratio of income tax expense (non-IFRS) to profit before tax (non-IFRS), expressed as a percentage.
Measures to Manage Our Non-Financial Performance
The following are the key measures we used to manage our non-financial performance in the reporting year.
We measure customer experience because we believe that we can only achieve our financial goals if our customers are satisfied with and loyal to SAP and our solutions. We assess customer experience annually by means of a survey that tracks our customer experience KPI based on a dedicated question on the survey. Historically our KPI metric has been the customer net promoter score (NPS), which is measured with the standard, proprietary “likelihood to recommend” question. Its proprietary scoring methodology arrives at the final NPS by taking the difference between the percentage of “Promoters” and “Detractors”, which are categorized based on customers’ numerical rating from 0-10. “Promoters” are customers who rate their likelihood to recommend SAP with a 9 or 10 on the 11-point scale; “Detractors” are customers rating us as a 0-6. The NPS calculation method ignores “Passives” giving a score of 7 or 8, which is a significant limitation of the metric. Based on the NPS methodology’s subtractive calculation based on percentages of two groups, the range of achievable scores is–100 to +100, with the latter being the best achievable score for customer loyalty.
Starting in 2026, we will revise our customer experience KPI framework by switching from Customer NPS (Net Promoter Score) to Cloud Customer Satisfaction (Cloud CSAT). The Cloud CSAT metric is calculated as a “top 2-box” score, taking the percentage of customers who are “very satisfied” or “satisfied” with SAP, as indicated on a 5-point scale that provides response options from “very satisfied” to “very dissatisfied”. Consequently, the range of achievable scores is between 0 and 100, with the latter being the best achievable score for customer satisfaction as measured by the Cloud CSAT methodology.
The Cloud CSAT KPI is calculated based on feedback from our cloud customers. A cloud customer is a customer providing feedback either (1) explicitly about one of the cloud solutions that they have implemented and are operationally running, or (2) giving feedback about “SAP in general” while having implemented and operationally running either exclusively one or more cloud solution(s) or has a mixed portfolio that does not include certain pre-defined solutions, confirmed to be running as on-premise. If a customer runs any of the pre-defined on-premise solutions (ERP On-Prem, HANA On-Prem, S/4HANA On-Prem, HCM On-Prem, SAP Business Objects, SAP Business Warehouse), with none running on private cloud, they are treated as an on-premise customer and their rating score is not considered in the Cloud CSAT calculation. The revenue generated with cloud solutions in any mixed portfolio counts towards cloud revenue reported in our financial information. With this change, SAP aligns the KPI to our cloud-first strategy. In 2025, the Cloud CSAT score was 75%.
The Employee Engagement Index12 measures the satisfaction and commitment of our employees, how proud they are of our company, and how strongly they identify with SAP. Applying this measure is recognition that our growth strategy depends on having engaged employees. The index is expressed as a percentage of favorable responses to five questions in our #Unfiltered engagement survey and we report it as the average of the scores retrieved in each of the surveys we run in a fiscal year. The #Unfiltered program is based on a “continuous listening” approach that includes two data collections throughout the year. The average scores provide an assessment, for the full year, of our employees’ engagement level.
The Business Health Culture Index (BHCI)13 reflects the extent to which SAP provides a working environment that promotes health, supports long-term employability, and fosters active engagement in achieving corporate goals. The index score is the percentage of favorable responses to 10 questions in our #Unfiltered engagement survey and we report it as the average of the scores retrieved in each of the surveys we run in a fiscal year. In the reporting year, the BHCI replaced the Women in Executive Roles measure as one of our key non-financial performance indicators. In 2025, we added equal opportunities as a new component of the index and replaced one of the health and well-being questions so that the revised index gives a holistic view of the employee experience at SAP across key themes, making it a strong indicator of a healthy work environment.
The gross greenhouse gas emissions metric is used to measure greenhouse gas emissions along the value chain (Scope 1, Scope 2, and Scope 3 emissions relevant to SAP’s business model) as part of our net-zero commitment. We apply a market-based approach. Renewable energies, for example in the form of self-generated renewable electricity, investments in certified renewable energy certificates, long-term green electricity contracts (power purchase agreements), and renewable electricity purchased by our suppliers and customers, can count toward the reduction of greenhouse gas emissions. We define, measure, and report our greenhouse gas emissions according to the Greenhouse Gas (GHG) Protocol (in millions of tons of CO2 equivalents). The reporting also complies with ESRS.
In 2026, we intend to revise the methodology we use to calculate Scope 3 GHG emissions. We will replace our current methodology for calculating category 11 emissions from the use of sold products, which is based on the total amount of active maintenance contracts, with a forward-looking approach that considers the estimated emissions during the lifetime of all new systems sold within a specific period. This change aligns our approach more closely with the GHG Protocol. The revised calculation methodology will result in a significant decrease in reported emissions and therefore lead to a re-baselining in accordance with the GHG Protocol. Had this methodology been applied in the reporting year, our 2025 GHG emissions would have been 3,590 kilotons.
12 Methodologies and significant assumptions behind the metric – Employee Engagement Index: ESRS 2 MDR-M 77 (a).
13 Methodologies and significant assumptions behind the metric – Business Health Culture Index: ESRS 2 MDR-M 77 (a).
Value-Based Management
Our holistic view of the performance measures described above, and the associated analyses, together form the foundation of our value-based management. We use planning and control processes to manage the compilation of these key measures and their availability to our decision-makers across various management levels. SAP’s long-term strategic plans are the point of reference for our short- and medium-term planning and controlling processes. We initially identify future growth and profitability drivers at a highly aggregated level for the entire SAP Group.
In a first step, the financial plan’s growth ambition is determined by the Group’s comprehensive product portfolio, which is grouped into solution areas, and profitability drivers are allocated to functions such as development, marketing, sales, delivery, and administration.
In a second step, the planned total revenues and total expenses are allocated to the operating segments and the areas of functional responsibility of the individual members of the Executive Board (“Board area”). If one of these Board areas represents both a functional department and operating segments, planned revenues and expenses are allocated at segment level. Budget adjustments may be applied during the year to reflect changes in priorities, to achieve efficiency targets, and to reflect internal and external factors. Budget adjustments and the assessment of the performance are managed either at the Board area level if the Board area constitutes a single segment, or at the segment level if the Board area comprises several segments. The Executive Board member is responsible for distributing the budget within the Board area or at segment level as applicable. Based on an integrated portfolio process running in parallel to the budgeting process, we ensure aligned investment behavior across Board areas with regard to specific solution or sub-solution areas.
In a final step, customer-facing revenue targets and cost-of-sales and marketing targets are broken down into sales regions and market units.
Based on our detailed annual plans, we determine the budget for the respective fiscal year. We also have processes in place to forecast revenue and profit on a quarterly basis, to quantify whether we expect to realize our financial targets, and to identify any deviations from plan. We continuously monitor the affected operating segments and board areas in the SAP Group to analyze their developments and define any appropriate actions. Our entire network of planning, controlling, and reporting processes is implemented in integrated planning and information systems, based on SAP software, across all organizational units so that we can conduct the evaluations and analyses needed to make informed decisions. Financial targets for headcount and expenses are substantially based on our topline ambitions. If we determine that SAP’s topline plans are at material risk of not being achieved, we need to be agile and ensure that planned expenses are still properly aligned to the Company’s overall financial ambition.
Non-IFRS Financial Measures Cited in This Report
Explanation of Non-IFRS Measures
We disclose certain financial measures that are not prepared in accordance with IFRS and are therefore considered non-IFRS financial measures. Our non-IFRS financial measures may not correspond to non-IFRS financial measures that other companies report. The non-IFRS financial measures that we report should only be considered in addition to, and not as substitutes for, nor as superior to, our IFRS financial measures.
We believe that the supplemental historical and prospective non-IFRS financial information we disclose is useful to investors because it is used by our management, in addition to financial data prepared in accordance with IFRS, to gain a more transparent understanding of our past performance and our anticipated future results.
We use the non-IFRS measures consistently in our internal planning and forecasting, reporting, and compensation, as well as in our external communications, as follows:
- Our management primarily uses the non-IFRS measures, rather than the IFRS measures, as the basis for making financial, strategic, and operating decisions.
- The variable components of our Executive Board members’ and employees’ remuneration are based on non-IFRS numbers rather than the respective IFRS measures. Although we exclude expenses related to regulatory compliance matters from non-IFRS results, starting in 2025 we no longer adjust for these expenses when determining the Executive Board members’ remuneration.
- The annual budgeting process for all management units is based on operating profit (non-IFRS) numbers rather than the respective IFRS financial measure.
- All forecast and performance reviews with all senior managers globally are based on the non-IFRS measures, rather than the respective IFRS financial measures.
- Both our internal performance targets and the guidance we provide to the capital markets are based on non-IFRS measures, rather than the respective IFRS financial measures.
Our non-IFRS financial performance measures reflect adjustments based on the items below, as well as adjustments for the related income tax effects.
Operating Expense (Non-IFRS)
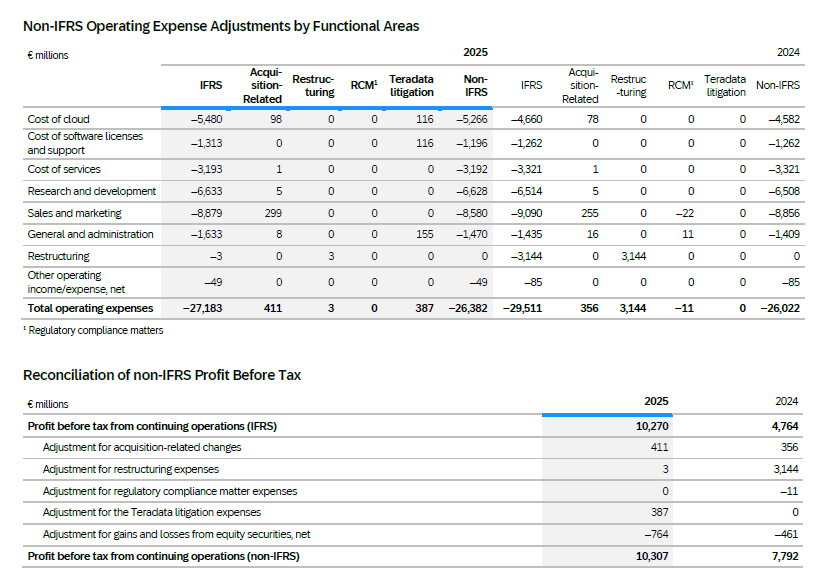
Numbers that are identified as operating expenses (non-IFRS) have been adjusted by excluding the following expenses:
- Acquisition-related charges
▪ Amortization expense/impairment charges for intangibles acquired in business combinations, including goodwill, and certain stand-alone acquisitions of intellectual property (including purchased in-process research and development)
▪ Settlements of preexisting business relationships in connection with a business combination
▪ Acquisition-related third-party expenses
- Restructuring expenses in accordance with IFRS. These costs are recognized when the Company has committed to a formal restructuring program, and a constructive obligation exists. For more information about our restructuring expenses, see the Notes to the Consolidated Financial Statements 2025, Note (B.6).
- Expenses for regulatory compliance matters associated with the provision for (potential) penalties arising from certain ongoing governmental investigations into our business operations, which are described in the Notes to the Consolidated Financial Statements 2025, Note (G.3), and are strictly limited to the scope of IAS 37.
- Expenses related to the Teradata litigation. These expenses include legal fees and expenses from settlements, or damages awarded in court, and are strictly limited to the scope of IAS 37. For more information about the Teradata litigation, see the Notes to the Consolidated Financial Statements 2025, Note G.3).
We exclude certain acquisition-related expenses for the purpose of calculating operating profit (non-IFRS) and operating margin (non-IFRS) when evaluating SAP’s continuing operational performance, because these expenses generally cannot be changed or influenced by management after the relevant acquisition other than by disposing of the acquired assets. Since management at levels below the Executive Board does not influence these expenses, we generally do not consider these expenses for the purpose of evaluating the performance of management units. We also exclude restructuring expenses because they are volatile and generally cannot be influenced by management at levels below the Executive Board. Furthermore, we exclude expenses for regulatory compliance matters, as these expenses are non-recurring and relate to conduct that took place in prior performance periods, so that users of our consolidated financial statements and the combined management report can see the information that our management uses to manage the business.
Effective 2025, numbers that are identified as operating profit (non-IFRS) are adjusted by excluding expenses related to the Teradata litigation, since these fees and expenses are not indicative of our operating performance or management’s allocation of resources to our ongoing business activities. By excluding these non-recurring expenses, SAP will provide additional insight into its operating performance, increase period-over-period comparability, and provide users of SAP’s financial statements the information that our management uses to manage the business.
Non-Operating Income, Net (Non-IFRS)
Numbers that are identified as non-operating income, net (non-IFRS) have been adjusted by excluding the following effects:
- Acquisition-related charges
▪ Net disposal gains and losses arising from the sale of intangibles acquired in business combinations
Consistent with the adjustments we make to our operating expenses (non-IFRS) by excluding amortization expenses and impairment charges for intangibles acquired in business combinations, we adjust our non-operating income, net (non-IFRS) by excluding disposal gains and losses arising from the sale of these intangibles. These net disposal gains and losses are not indicative of SAP’s operations. We believe that by excluding these gains and losses, we improve our period-over-period comparability.
Financial Income, Net (Non-IFRS)
Numbers that are identified as financial income, net (non-IFRS) have been adjusted by excluding the following gains and losses:
- Gains and losses from equity securities, net
▪ Includes realized and unrealized effects from the disposal of equity securities, ongoing mark-to-market adjustments on marketable equity investments, changes in fair value of non-marketable equity securities, and others.
Excluding gains and losses from equity securities, net, improves the period-over-period comparability by reducing volatility caused by share price fluctuation, market developments, and other factors beyond our control.
Effective Tax Rate (Non-IFRS)
The effective tax rate (non-IFRS) is presented for supplemental informational purposes only. We do not provide an outlook for the effective tax rate (IFRS) due to the uncertainty and potential variability of gains and losses associated with equity investments, which are reconciling items between the two effective tax rates (non-IFRS and IFRS). These items cannot be provided without unreasonable efforts, but they could have a significant impact on our future effective tax rate (IFRS).
Constant Currencies Information
We believe it is important for investors to have information that provides insight into the development of our sales. Revenue measures determined under IFRS provide information that is useful in this regard. However, both sales volume and currency effects impact period-over-period changes in sales revenue. We do not sell standardized units of products and services so we cannot provide relevant information on sales volume by providing data on the changes in product and service units sold. To provide additional information that may be useful to investors in breaking down and evaluating changes in sales volume, we present information about our revenue and about various values and components relating to operating profit that are adjusted for foreign currency effects. We calculate constant currency measures by translating foreign currencies using the average exchange rates from the comparative period instead of the current period. Constant currency values for our current cloud backlog and total cloud backlog measures use the closing exchange rate from the previous year’s corresponding key date instead of the average exchange rate.
Free Cash Flow
Among other measures, we use free cash flow to manage our overall financial performance. In 2025, we revised our definition of free cash flow so that it now includes the proceeds from sales of intangible assets and property, plant, and equipment, and therefore better reflects how SAP’s management evaluates the cash flow generated by operating activities after investments in long-term assets and leasing. We define free cash flow as net cash from operating activities adjusted for purchases of intangible assets and property, plant, and equipment; for proceeds from sales of intangible assets and property, plant, and equipment; and for payments of lease liabilities. Further impacting our free cash flow, effective 2025 we no longer include interest paid and interest received in net cash flows from operating activities. For more information, see the Notes to the Consolidated Financial Statements 2025, Note (IN.1). Prior year amounts were adjusted accordingly.
Usefulness of Non-IFRS Measures
We believe that our non-IFRS measures are useful to investors for the following reasons:
- Our non-IFRS measures provide investors with insight into management’s decision-making because management uses these measures to run our business and make financial, strategic, and operating decisions. We exclude the expense adjustments outlined above when making decisions to allocate resources. In addition, we use these non-IFRS measures to facilitate comparisons of SAP’s operating performance from period to period.
- The non-IFRS measures provide investors with additional information that enables a comparison of year-over-year operating and non-operating performance by excluding certain direct effects of acquisitions, restructuring plans, regulatory compliance matters, the Teradata litigation, and gains and losses from equity securities, net.
- Non-IFRS and non-GAAP (Generally Accepted Accounting Principles) measures are widely used in the software industry. In many cases, our non-IFRS measures may facilitate comparisons with our competitors’ corresponding non-IFRS and non-GAAP measures.
Limitations of Non-IFRS Measures
Without being analyzed in conjunction with the corresponding IFRS measures, the non-IFRS measures are not indicative of our present and future performance primarily for the following reasons:
- While our profit (non-IFRS) numbers reflect the elimination of certain acquisition-related expenses, no eliminations are made for the additional revenue or other income that results from the acquisitions.
- The acquisition-related amortization expense that we eliminate in deriving our profit (non-IFRS) numbers is a recurring expense that will impact our financial performance in future years.
- The remaining acquisition-related charges that we eliminate in deriving our profit (non-IFRS) numbers are likely to recur if SAP enters into business combinations in the future. Similarly, the restructuring expenses that we eliminate in deriving our profit (non-IFRS) numbers are likely to recur if SAP restructures its operations in the future.
- The expense adjustment for acquisition-related charges does not arise from a common conceptual basis. This is because the expense adjustment aims to improve comparability between post-acquisition periods and pre-acquisition periods. This should particularly be considered when evaluating our operating profit (non-IFRS) and operating margin (non-IFRS) numbers, as these combine our revenue and expenses (non-IFRS) despite the absence of a common conceptual basis.
- Our restructuring charges resulted in significant cash outflows in the past and could do so in the future.
- Expenses ascribed to regulatory compliance matters may include penalties and legal costs, and expenses ascribed to the Teradata Litigation may include legal costs, expenses from settlements, and damages awarded in court, all of which would impact the operating cash flows of the business.
- The gains and losses from equity securities, net, that we eliminate in deriving our financial income, net (non-IFRS) numbers are recurring effects that have impacted our financial performance in the past and will do so in the future. Similarly, the acquisition-related effects related to the sale of intangibles arising from business combinations that we eliminate in deriving our non-operating income, net (non-IFRS) have impacted our financial performance in the past and could do so in the future.
- Our realized net gains from equity securities resulted in significant cash inflows in the past and could do so in the future.
We believe that constant currency measures have limitations, particularly as the currency effects that are eliminated constitute a significant element of our revenue and expenses and could materially impact our performance. We therefore limit our use of constant currency measures to the analysis of changes in volume as one element of the full change in a financial measure.
Despite these limitations, we believe that the presentation of our non-IFRS measures and the corresponding IFRS measures, together with the relevant reconciliations, provides useful information to management and investors about present and future business trends relating to our financial condition and results of operations.