Wilmar International Limited – Annual report – 31 December 2025
Industry: agriculture
2. MATERIAL ACCOUNTING POLICY INFORMATION (extract)
2.12 Bearer plants and biological assets
Bearer plants are living plants used in the production or supply of agricultural produce, are expected to bear produce for more than one period, and have a remote likelihood of being sold as agricultural produce, except for incidental scrap sales.
Bearer plants mainly include mature and immature oil palm plantations. Immature plantations are stated at acquisition cost which includes costs incurred for field preparation, planting, fertilising and maintenance, capitalisation of borrowing costs incurred on loans used to finance the developments of immature plantations and an allocation of other indirect costs based on planted hectares. Mature plantations are stated at acquisition cost less accumulated depreciation and impairment. Mature plantations are depreciated on a straight line basis and over its estimated useful life of 20-25 years, upon commencement of commercial production.
In general, oil palms are considered mature 30 to 36 months after field planting.
Interest on borrowings to finance the acquisition and construction of bearer plants is capitalised during the period of time that is required to complete and prepare the bearer plants for its intended use. All other borrowing costs are expensed.
The carrying values of bearer plants are reviewed for impairment when events or changes in circumstances indicate that the carrying value may not be recoverable. The residual values, useful life and depreciation method are reviewed at each financial year end to ensure that the amount, method and period of depreciation are consistent with previous estimates and the expected pattern of consumption of the future economic benefits.
A bearer plant is derecognised upon disposal or when no future economic benefits are expected from its use or disposal. Any gain or loss arising on derecognition of the bearer plant is included in the income statement in the year the bearer plant is derecognised.
Produce that grows on mature plantations are measured at fair value less estimated point-of-sale costs.
Point-of-sale costs include all costs that would be necessary to sell the produce.
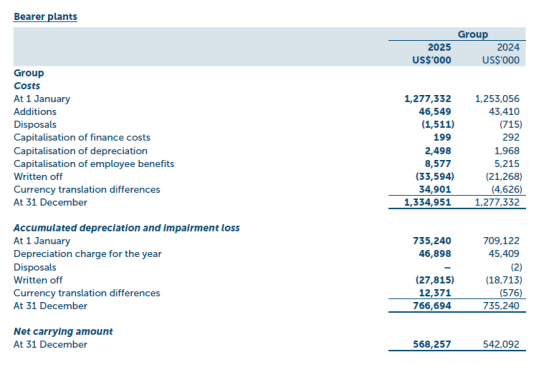
14. BEARER PLANTS
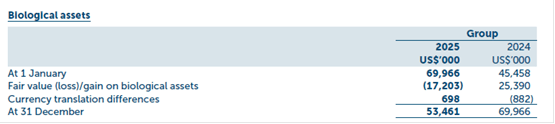
BIOLOGICAL ASSETS
(a) Analysis of oil palm production
During the financial year, the Group harvested approximately 4,040,000 metric tonnes (2024: 4,109,000 metric tonnes) of fresh fruit bunch (“FFB”), which had a fair value less estimated point-of-sale costs of approximately US$764,635,000 (2024: US$699,292,000). The fair value of FFB was determined with reference to their monthly average market prices during the year.
(b) Analysis of bearer plants
At the end of the financial year, the Group’s total planted area and related value of mature and immature plantations are as follows:–
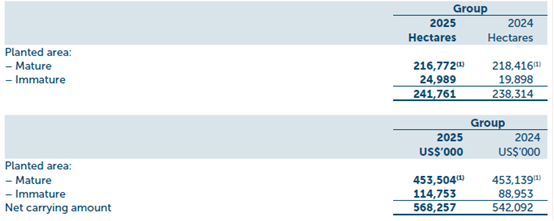
1) Mature planted areas include sugar cane plantations.
(c) The finance costs capitalised is actual interest incurred on the bank borrowings used to finance the development of oil palm plantations.
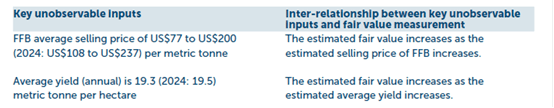
(d) The fair value of biological assets has been determined based on the market price and the estimated yield of FFB, net of maintenance and harvesting costs, overhead costs and estimated cost to sell. The estimated yield is dependent on the age of the oil palm trees, the location of the plantations, soil type and infrastructure. The market price of the FFB is largely dependent on the prevailing market prices of crude palm oil and palm kernel. Point-of-sale costs include all costs that would be necessary to sell the assets.
The following table shows the key unobservable inputs used in the valuation models:
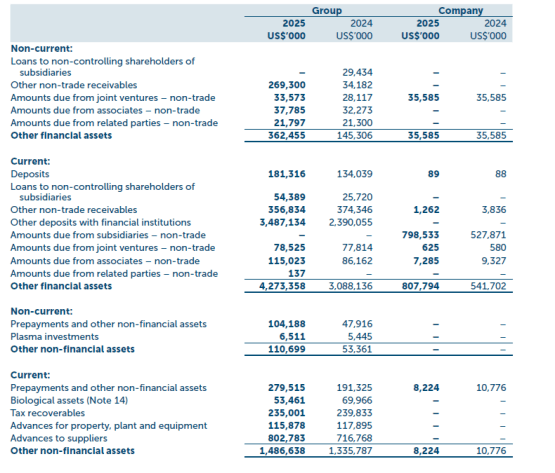
21. OTHER FINANCIAL ASSETS (extract)
OTHER NON-FINANCIAL ASSETS (extract)
34. FAIR VALUE OF ASSETS AND LIABILITIES (extract)
(a) Fair value of assets and liabilities that are carried at fair value
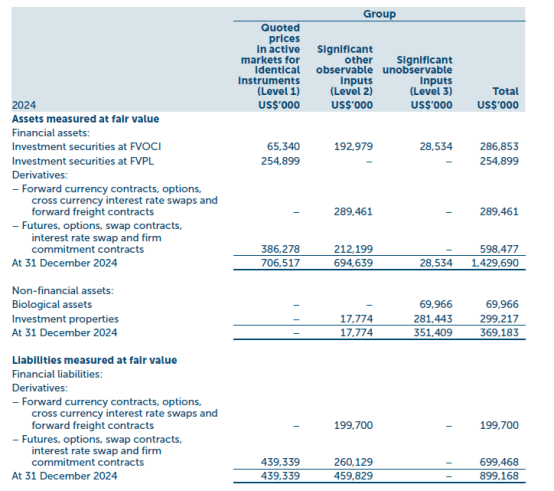
The following table shows an analysis of assets and liabilities carried at fair value by level of fair value hierarchy:
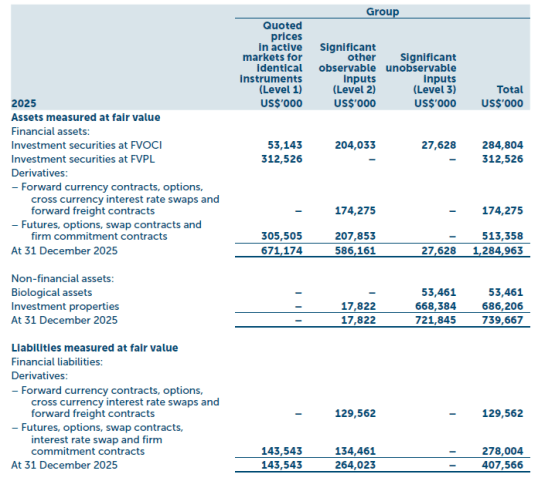
Fair value hierarchy
The Group classifies fair value measurement using a fair value hierarchy that reflects the significance of the inputs used in making the measurements. The fair value hierarchy has the following levels:
– Level 1 – Quoted prices (unadjusted) in active markets for identical assets or liabilities that the Group can access at the measurement date,
– Level 2 – Inputs other than quoted prices included within Level 1 that are observable for the asset or liability, either directly (i.e., as prices) or indirectly (i.e., derived from prices), and
– Level 3 – Inputs for the asset or liability that are not based on observable market data (unobservable inputs).
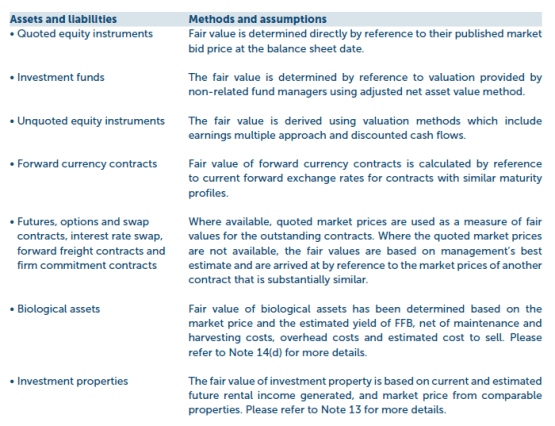
Methods and assumptions used to determine fair values
The methods and assumptions used by management to determine fair values of assets and liabilities other than those whose carrying amounts reasonably approximate their fair values, as mentioned in Note 34(b), are as follows:
Movements in Level 3 assets and liabilities measured at fair value
The following table presents the reconciliation for all assets and liabilities measured at fair value based on significant unobservable inputs (Level 3).
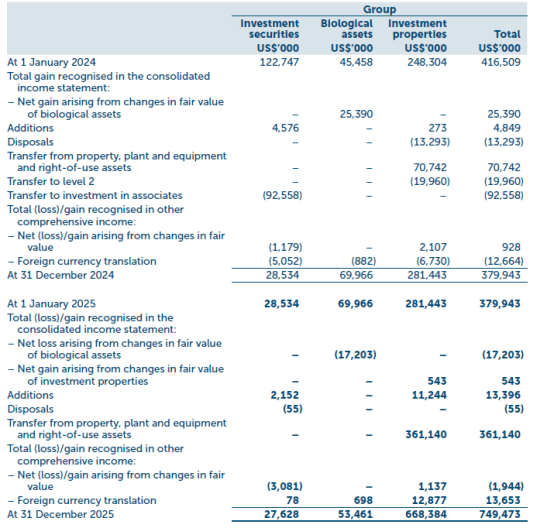
There has been no transfer of investment securities from Level 1 and Level 2 to Level 3 for the financial year ended 31 December 2025 and 31 December 2024.
There has been transfer of an investment property from Level 3 to Level 2 for the financial year ended 31 December 2024 based on market price valuation.
Impact of changes to key assumptions Level 3 fair value measurement of financial instruments
The following table shows the impact on Level 3 fair value measurement of financial instruments by using reasonably possible alternative assumptions:
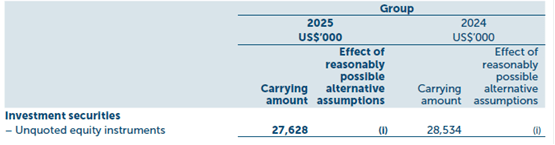
(i) The fair value of unquoted equity instruments was determined using valuation methods which included the earnings multiple approach and discounted cash flow approach.
35. FINANCIAL RISK MANAGEMENT OBJECTIVES AND POLICIES (extract)
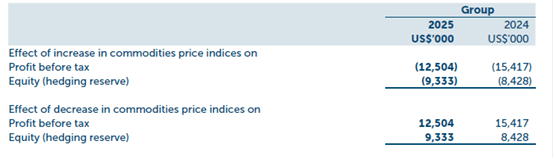
(e) Commodity price risk
The prices of agricultural commodities are subject to wide fluctuations due to unpredictable factors such as weather, government policies, changes in global demand resulting from population growth and changes in standards of living, and global production of similar and competitive crops. During its ordinary course of business, the value of the Group’s open sales and purchases commitments and inventory of raw material changes continuously in line with movements in the prices of the underlying commodities. To the extent that its open sales and purchases commitments do not match at the end of each business day, the Group is subjected to price fluctuations in the commodities market.
While the Group is exposed to fluctuations in agricultural commodities prices, its policy is to minimise its risks arising from such fluctuations by hedging its sales either through direct purchases of a similar commodity or through futures contracts on the commodity exchanges. The prices on the commodity exchanges are generally quoted up to twelve months forward.
In the course of hedging its sales either through direct purchases or through futures, options and swap contracts, the Group may also be exposed to the inherent risk associated with trading activities conducted by its personnel. The Group has in place a risk management system to manage such risk exposure.
At the balance sheet date, a 1% (2024: 1%) increase/decrease of the commodities price indices, with all other variables held constant, would have (decreased)/increased profit before tax and equity by the amounts as shown below: