Tesco PLC – Annual report – 22 February 2025
Industry: retail
Note 15 Impairment of non-current assets
Impairment losses and reversals
Goodwill
There was no impairment of goodwill balances in the current year (2024: £211m related to the sale of the Group’s Banking operations).
Other non-current assets
The tables below summarise the Group’s pre-tax impairment losses and reversals on other non-current assets, aggregated by segment due to the large number of individually immaterial cash-generating units. This includes any (losses)/reversals recognised immediately prior to classifying an asset or disposal group as held for sale but excludes any changes in fair value less costs to sell post classification as held for sale. There were no impairment losses or reversals in the year (2024: £nil) with respect to investments in joint ventures and associates. Impairments are typically treated as adjusting where there is significant volatility arising from inputs outside the control of management.

The net impairment loss is primarily due to increases in discount rates, as a result of the continued upward trend in government bond rates, as well as future cost pressures. The gross non-current asset impairment losses and reversals largely reflect normal fluctuations expected from store-level performance, as well as any specific store closures.
Net carrying value of non-current assets
The net carrying values of other non-current assets and the recoverable amounts of impaired other non-current assets, for which an impairment loss has been recognised or reversed, have been aggregated by segment due to the large number of individually immaterial cash-generating units.
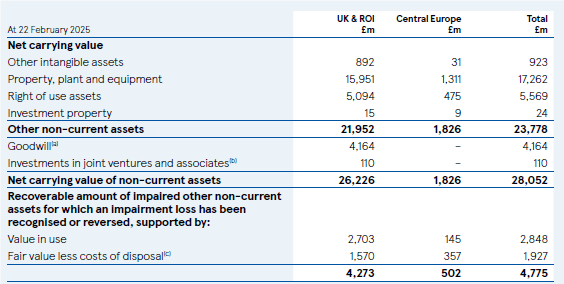
(a) Goodwill of £4,164m (2024: £4,128m) consists of UK £3,702m (2024: £3,664m), dunnhumby £141m (2024: £142m), money services £171m (2024: £171m), insurance £118m (2024: £118m) and ROI £32m (2024: £33m).
(b) The carrying value of the Group’s investments includes Trent Hypermarket Private Limited £60m (2024: £63m).
(c) Due to the individual nature of each property, fair values are classified as Level 3 within the fair value hierarchy. Certain store cash-generating units are supported by fair value less costs of disposal where their current use is for trading. This use is consistent with the Group’s property strategy and expected future investment in these store cash-generating units.

(a)-(c) Refer to previous table for footnotes.
(d) Comparatives have been restated to reflect the reclassification of Insurance and Money Services from the former Tesco Bank segment to the UK & ROI segment. Refer to Note 2.
Impairment methodology
Cash-generating units
For impairment testing of other intangible assets, property, plant and equipment, right of use assets and investment property, the Group treats each store as a separate cash-generating unit. dunnhumby, insurance and money services each represent separate cash-generating units.
The Group allocates goodwill to groups of cash-generating units based on the lowest level at which goodwill is monitored by management. Each country represents a group of cash-generating units for the Group’s retail operations. dunnhumby, insurance and money services each represent separate groups.
The recoverable amount of each store cash-generating unit is the higher of its value in use and its fair value less costs of disposal. The recoverable amount of a group of cash-generating units to which goodwill has been allocated is determined based on value in use calculations.
Central assets such as distribution centres and associated costs are allocated to store cash-generating units based on level of use, estimated with reference to sales. Urban fulfilment centres and associated costs that are part of a store are included in the store cash–generating unit. Standalone customer fulfilment centres and associated costs are each treated as a separate cash-generating unit.
Value in use
Retail
Estimates for value in use calculations include discount rates, long-term growth rates, expected changes to future cash flows, including volumes and prices, and the probabilities assigned to cash flow scenarios. Estimates are based on past experience and expectations of future changes in the market, including the prevailing economic climate and global economy, competitor activity, market dynamics, changing customer behaviours, structural challenges facing retail and the resilience afforded by the Group’s operational scale.
Cash flow projections are based on the Group’s three-year internal forecasts, the results of which are reviewed by the Board. The forecasts include best estimate assumptions on inflation, which differ by both country and revenue and cost categories. These cash flows are then extrapolated to five years based on management’s expectations, and beyond five years based on estimated long-term average growth rates. Long-term growth rates are based on inflation forecasts by recognised bodies. Group-level cash flow forecasts are allocated to store-level cash-generating units based on their relative current year actual sales performance, after adjusting for one-off cash flows affecting particular stores.
The Group applies an expected cash flow approach by probability-weighting different cash flow scenarios. The greatest probability weighting is applied to the cash flows derived from the three-year internal forecasts. One downside scenario takes account of the risks presented by ongoing geopolitical events triggering global supply chain challenges and resurgent inflation, leading to weak consumer confidence and further intensifying competition in the sector. A second downside scenario takes account of climate change impacts. These are consistent with the viability statement scenarios (see the Longer term viability statement in the Strategic report). The viability statement scenarios reflect ‘severe but plausible’ risks, to which management applies probability weightings in order to reflect management’s best estimate of future economic conditions. There is also an upside scenario which assumes a moderate outperformance of the three-year internal forecasts.
In addition to the climate change scenario included within the probability-weighted cash flows, the Group incorporates other climate change related assumptions into the impairment modelling, including, but not limited to, investments in technology to aid the Group’s net zero commitments, the costs associated with replacing end-of-life assets with more environmentally-friendly alternatives, and assumptions over the cash flow profile of the Group’s fuel business.
Pre-tax nominal discount rates that reflect the current market assessment of the time value of money are derived from the Group’s post-tax weighted average cost of capital, adjusted for specific risks relating to each geographical region or cash-generating unit for which the cash flows have not been adjusted. The Group engages independent valuation specialists to determine appropriate discount rates. Risk-free rates are based on government bond rates, adjusted for each geographical region, and equity risk premia and equity betas are based on data from recognised bodies. The capital asset pricing model is used to calculate the cost of equity.
Insurance and Money Services
Value in use is calculated by discounting post-tax free cash flows. Cash flow projections are based on the three-year internal forecasts approved by the Board. The forecasts are extrapolated to five years based on management’s expectations and beyond five years based on estimated long-term average growth rates. The long-term growth rates are based on inflation and GDP growth forecasts by recognised bodies. The post-tax discount rate is the cost of equity, which is calculated using the capital asset pricing model. The Group engages independent valuation specialists to determine appropriate discount rates. Risk-free rates are based on government bond rates and equity risk premia and equity betas are based on data from recognised bodies.
Fair value less costs of disposal
Fair values of owned properties are determined with regard to the market rent for the stores or for alternative uses with investment yields appropriate to reflect the physical characteristics of the property, location, performance, infrastructure, energy efficiency rating, redevelopment potential and other factors. Fair values of leased properties are determined with regard to the discounted market rent for the property over the remaining period of the lease, reflecting the condition and location of the property and the local rental market, adjusted for a suitable void period. Fair values of the Group’s properties were determined with the assistance of independent professional valuers where appropriate. Costs of disposal are estimated based on past experience in each geographical region.
Investments in joint ventures and associates
The recoverable values of investments in joint ventures and associates are estimated taking into account forecast cash flows, equity valuations of comparable entities and/or recent transactions for comparable businesses.
Key assumptions and sensitivity
Key assumptions
For value in use calculations, the key assumptions to which the recoverable amounts are most sensitive are discount rates, long-term growth rates and future cash flows (incorporating sales volumes, prices and costs). For fair value less costs of disposal calculations, the key assumption is property fair values.
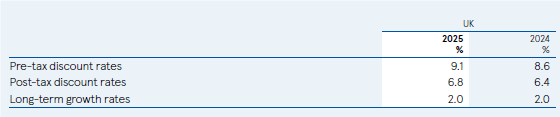
The discount rates and long-term growth rates relating to the goodwill carrying values that are significant to the Group’s total goodwill are:
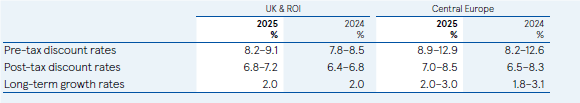
The discount rates and long-term growth rates for the Group’s portfolio of store cash-generating units, aggregated by segment due to the large number of individually immaterial store cash-generating units, are:
Sensitivity
The Group has carried out sensitivity analyses on the reasonably possible changes in key assumptions in the impairment tests for (a) the goodwill carrying values that are significant compared to the Group’s total goodwill and (b) for its portfolio of store cash-generating units.
(a) Neither a reasonably possible increase of 1.0%pt in discount rates, a 5.0% decrease in future cash flows nor a 0.5%pt decrease in long-term growth rates would indicate impairment in the goodwill carrying values that are significant compared to the Group’s total goodwill.
(b) While there is not a significant risk of an adjustment to the carrying amount of any one store cash-generating unit that would be material to the Group as a whole in the next financial year, the table below summarises the reasonably possible changes in key assumptions which most impact the impairment of the Group’s entire portfolio of store cash-generating units, presented in aggregate due to the large number of individually immaterial store cash-generating units. For the probability-weighted cash flow scenarios, the impairment is most sensitive to the downside scenario relating to geopolitical and global supply issues (weighting 6.5%). Impairment is not highly sensitive to the climate or upside scenarios. The reasonably possible change below applies the corresponding change to the base scenario.

* Sensitivities are applied to post-tax discount rates used to derive the pre-tax discount rates.
Judgements and sources of estimation uncertainty (extract)
Key sources of estimation uncertainty (extract)
Impairment of non-financial assets
The Group evaluates non-current assets for impairment as set out in Note 15. The key assumptions and estimates to which the recoverable amounts are most sensitive, the methodology for calculating them and sensitivities are also disclosed in Note 15.
